Labels
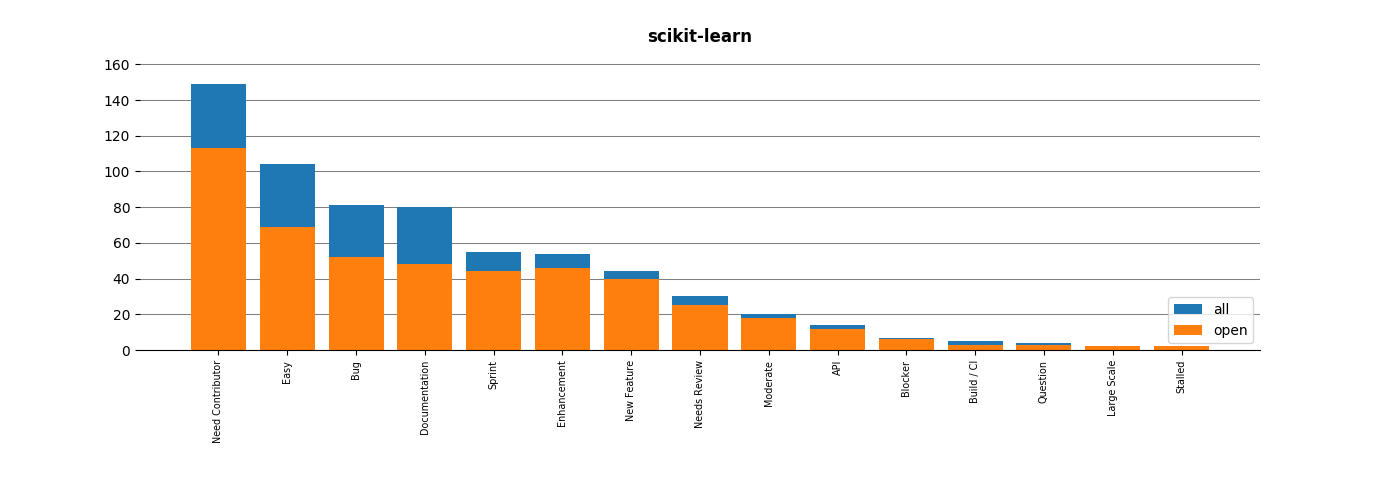
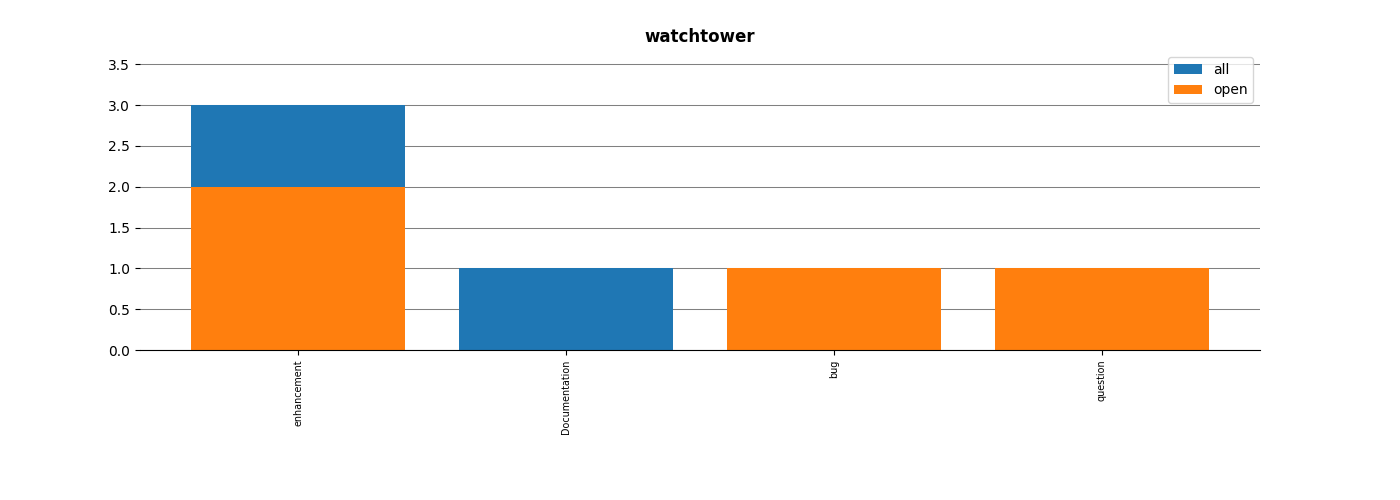
In this small examples, we compare labels between the different projects:
- scikit-learn
- watchtower
Out:
Updating repository: https://api.github.com/repos/scikit-learn/scikit-learn/commits
Params: {'since': '2017-02-01', 'per_page': 100}
Updating repository: https://api.github.com/repos/docathon/watchtower/commits
Params: {'since': '2017-02-01', 'per_page': 100}
import numpy as np
import pandas as pd
from watchtower import GithubDatabase
import matplotlib.pyplot as plt

projects = (("scikit-learn", "scikit-learn"),
            ("docathon", "watchtower"))
db = GithubDatabase(verbose=True)

update_issues = True  # Do we update the database
since = '2017-02-01'

for user, project in projects:
    if update_issues is True:
        db.update(user, project, since=since)

    proj = db.load(user, project)
    if proj.issues is None:
        print('No data for {}'.format(project))
        continue
    all_issues = proj.issues
    open_issues = all_issues.query('state == "open"')

    # Extract the names of the labels
    all_labels = np.array([name for names in all_issues['label_names'].values
                           for name in names])
    open_labels = np.array([name for names in open_issues['label_names'].values
                            for name in names])
    unique_labels = np.unique(all_labels)
    counts = dict()
    for label in unique_labels:
        n_instances = np.sum(all_labels == label)
        n_open = np.sum(open_labels == label)
        counts[label] = (n_instances, n_open)
    counts = pd.DataFrame(counts).T
    counts.columns = ['all', 'open']
    counts = counts.sort_values('all', ascending=False)

    fig = plt.figure(figsize=(14, 5))
    ax = fig.add_axes([0.1, 0.3, 0.8, 0.6])
    ax.grid("off")
    ax.spines['right'].set_color('none')
    ax.spines['left'].set_color('none')
    ax.spines['top'].set_color('none')
    ax.xaxis.set_ticks_position('bottom')
    ax.yaxis.set_ticks_position('left')

    for column in counts.columns:
        ixs = range(counts.shape[0])
        ax.bar(ixs, counts[column], label=column)
    ax.set_xticks(ixs)
    ax.set_xticklabels(counts.index, rotation=90, fontsize="x-small")

    yticks = ax.get_yticks()
    for l in yticks:
        ax.axhline(l, linewidth=0.75, zorder=-10, color="0.5")
    ax.set_yticks(yticks)
    ax.set_title(project, fontweight="bold")

    ax.legend()
plt.show()
Total running time of the script: ( 0 minutes 3.375 seconds)