Identifying documentation commits
This example shows how to identify documentation specfic commits.
Out:
Updating repository: https://api.github.com/repos/docathon/watchtower/commits
Params: {'since': '2017-02-10', 'per_page': 100}
Updating repository: https://api.github.com/repos/scikit-learn/scikit-learn/commits
Params: {'since': '2017-02-10', 'per_page': 100}
User Database | 2 Users | 2 projects
from watchtower.handlers_ import GithubDatabase
import matplotlib.pyplot as plt
import numpy as np
import pandas as pd
projects = [('docathon', 'watchtower'),
('scikit-learn', 'scikit-learn')]
def is_doc(string):
check_strings = ['doc', 'documentation', 'docathon']
is_doc = any(istr in string for istr in check_strings)
return is_doc
update_db = True
# Initialize the database
db = GithubDatabase(verbose=True)
# Update users and print the db
since = '2017-02-10'
if update_db is True:
for user, project in projects:
db.update(user, project, since=since)
since = pd.to_datetime(since)
print(db)
# Load the data for plotting
projects = [db.load(user, project) for user, project in projects]
# Now plot pushes each day
fig, axs = plt.subplots(nrows=2, figsize=(8, 6), sharex=True, sharey=True)
for proj, ax in zip(projects, axs):
proj.commits['is_doc'] = proj.commits['message'].apply(is_doc)
proj.commits = proj.commits.query('date > @since')
all_commits = proj.commits.resample('D').count().\
replace(np.nan, 0).astype(int)
doc_commits = proj.commits.resample('D').sum().\
replace(np.nan, 0).astype(int)
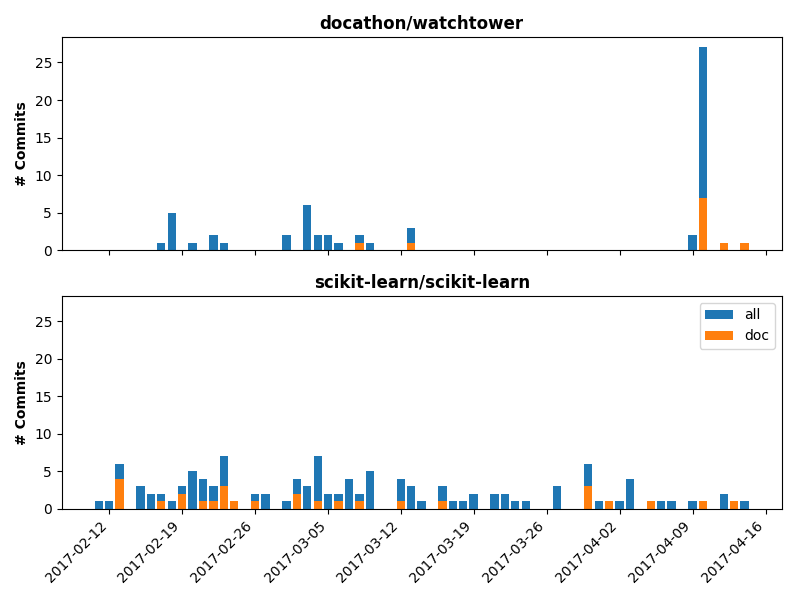
ax.bar(all_commits.index, all_commits['is_doc'], label='all')
ax.bar(doc_commits.index, doc_commits['is_doc'], label='doc')
ax.set_title("{}/{}".format(proj.user, proj.project), fontweight="bold")
ax.set_ylabel('# Commits', fontweight="bold")
axs[-1].legend()
plt.setp(axs[-1].get_xticklabels(), rotation=45, horizontalalignment='right')
plt.setp([ax.xaxis.label for ax in axs], visible=False)
plt.tight_layout()
plt.show()
Total running time of the script: ( 0 minutes 3.380 seconds)